从sklearn开始机器学习 2聚类分类回归和逻辑回归

基本上开始照搬这篇文章了,我可能会做小改动,比如排版什么的或者去其他地方搬运一点,但是先把这个文章贴上。
『行远见大』Python 进阶篇:Sklearn 库

聚类模型

聚类与分类的区别在于聚类不依赖于预先定义的类,没有预定义的类和样本——聚类是一种无监督的数据挖掘任务。

聚类的概念

  • 聚类是把各不同的个体分割为有更多相似性子集合的工作
  • 聚类生成的子集合称为簇

聚类的要求

  • 生成的簇内部的任意两个对象之间具有较高的相似度
  • 属于不同簇的两个对象间具有较高的相异度
1
2
3
4
5
6
7
8
9
10
11
from sklearn.datasets import load_iris
from sklearn.cluster import KMeans
iris = load_iris()

# 实例化K-Means聚类算法类
k_means = KMeans(n_clusters=3) # 类中心个数为3
k_means.fit(iris['data']) # 执行聚类操作

print(iris.target) # 查看聚类标签
print(k_means.labels_) # 查看各样本聚类标签,聚类标签顺序前后无所谓,重要的是这些样本是不是同一类
print(k_means.cluster_centers_) # 查看各聚类中心,因为每个样本有四个值,这里展示同一类样本的中心值
1
2
3
4
5
6
7
8
9
10
11
12
13
[0 0 0 0 0 0 0 0 0 0 0 0 0 0 0 0 0 0 0 0 0 0 0 0 0 0 0 0 0 0 0 0 0 0 0 0 0
0 0 0 0 0 0 0 0 0 0 0 0 0 1 1 1 1 1 1 1 1 1 1 1 1 1 1 1 1 1 1 1 1 1 1 1 1
1 1 1 1 1 1 1 1 1 1 1 1 1 1 1 1 1 1 1 1 1 1 1 1 1 1 2 2 2 2 2 2 2 2 2 2 2
2 2 2 2 2 2 2 2 2 2 2 2 2 2 2 2 2 2 2 2 2 2 2 2 2 2 2 2 2 2 2 2 2 2 2 2 2
2 2]
[0 0 0 0 0 0 0 0 0 0 0 0 0 0 0 0 0 0 0 0 0 0 0 0 0 0 0 0 0 0 0 0 0 0 0 0 0
0 0 0 0 0 0 0 0 0 0 0 0 0 2 2 1 2 2 2 2 2 2 2 2 2 2 2 2 2 2 2 2 2 2 2 2 2
2 2 2 1 2 2 2 2 2 2 2 2 2 2 2 2 2 2 2 2 2 2 2 2 2 2 1 2 1 1 1 1 2 1 1 1 1
1 1 2 2 1 1 1 1 2 1 2 1 2 1 1 2 2 1 1 1 1 1 2 1 1 1 1 2 1 1 1 2 1 1 1 2 1
1 2]
[[5.006 3.428 1.462 0.246 ]
[6.85 3.07368421 5.74210526 2.07105263]
[5.9016129 2.7483871 4.39354839 1.43387097]]
1
2
3
4
5
6
# 对模型的性能进行评估
from sklearn.metrics import adjusted_rand_score, silhouette_score
# help(adjusted_rand_score) # 兰德系数介绍
print(adjusted_rand_score(iris['target'], k_means.labels_)) # 利用兰德系数对聚类模型进行效果评估
# silhouette_score? # 轮廓系数评价法介绍
print(silhouette_score(iris['data'], k_means.labels_)) # 轮廓系数评价法对聚类模型进行效果评估
1
2
0.7302382722834697
0.5528190123564091

老实讲没太懂这一波调用和评估。有亿点点懵,等我先copy下来再优化 。

1
2
3
4
5
6
7
8
9
10
11
12
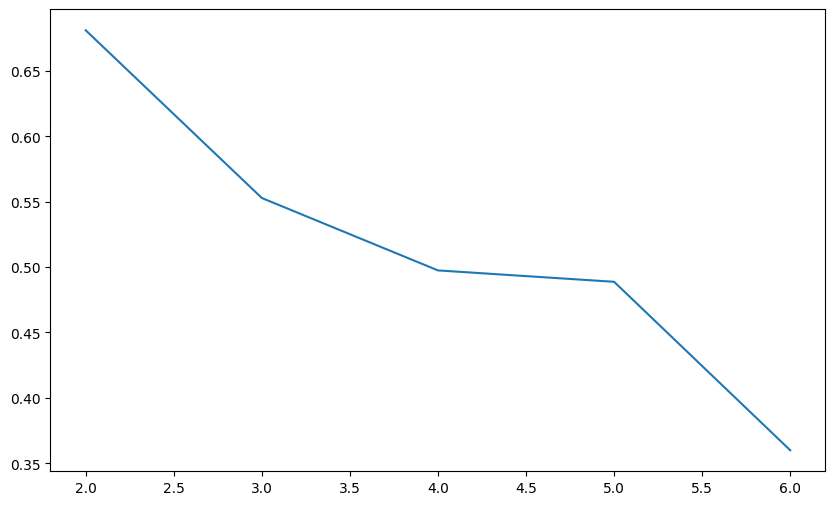
import matplotlib.pyplot as plt
scores = []
for k in range(2,7):
# 构建并训练模型
kmeans = KMeans(n_clusters=k, random_state=123).fit(iris['data'])
score = silhouette_score(iris['data'], kmeans.labels_) # 查看畸变状况
scores.append(score)
print('iris数据聚%d类calinski_harabaz指数为:%f'%(k,score))

plt.figure(figsize=(10,6))
plt.plot(range(2,7),scores,linewidth=1.5, linestyle="-")
plt.show()
1
2
3
4
5
iris数据聚2类calinski_harabaz指数为:0.681046
iris数据聚3类calinski_harabaz指数为:0.552819
iris数据聚4类calinski_harabaz指数为:0.497455
iris数据聚5类calinski_harabaz指数为:0.488749
iris数据聚6类calinski_harabaz指数为:0.359943

分类模型

常见的分类算法

模块名称 函数名称 算法名称
linear_model LogisticRegression 逻辑回归
svm SVC 支持向量机
neighbors KNeighborsClassifier K最近邻居分类
naive_bayes GaussianNaiveBayes 高斯朴素贝叶斯
tree DecisionTreeClassifier 分类决策树
ensemble RandomForestClassifier 随机森林分类
ensemble GradientBoostingClassifer 梯度提升分类树

因为大佬的算法讲解看起来也很详细,于是就保留了超链接。

构建分类模型

这个案例使用的模型是分类决策树DecisionTreeClassifier.

1
2
3
4
5
6
7
8
9
10
11
12
13
from sklearn.datasets import load_iris
from sklearn.tree import DecisionTreeClassifier
from sklearn.model_selection import train_test_split

iris = load_iris(return_X_y=True)

X = iris[0]
y = iris[1]

# 数据准备
X_train, X_test, y_train, y_test = train_test_split(X, y, test_size=0.2, stratify=y)
print(X_train.shape)
print(X_test.shape)
1
2
(120, 4)
(30, 4)

参数:
return_X_y : 布尔值,默认为False,如果是True的话,返回(data, target)代替Bunch对象.

返回值:
Bunch对象.类似于字典的对象.其中的属性有:‘data’, the data to learn, ‘target’, the regression targets, and ‘DESCR’, the full description of the dataset.
或者是(data, target) :当return_X_y设为True的时候.

1
2
3
4
# 实例化决策树分类器
clf = DecisionTreeClassifier()
# 训练模型
clf.fit(X_train, y_train)
1
2
3
4
5
6
DecisionTreeClassifier(ccp_alpha=0.0, class_weight=None, criterion='gini',
max_depth=None, max_features=None, max_leaf_nodes=None,
min_impurity_decrease=0.0, min_impurity_split=None,
min_samples_leaf=1, min_samples_split=2,
min_weight_fraction_leaf=0.0, presort='deprecated',
random_state=None, splitter='best')
1
2
3
# 查看模型的类别
print(clf.classes_)
print(clf.feature_importances_)
1
2
[0 1 2]
[0.01666667 0. 0.0534188 0.92991453]

评价分类模型

1
2
3
4
5
6
7
8
9
# 方法一
# 调用模型对测试样本的标签进行预测
predicted = clf.predict(X_test)
# 预测值
print(predicted)
# 真实值
print(y_test)
# 模型精确率(accuracy)
print((predicted == y_test).mean())
1
2
3
[2 1 1 2 0 0 2 1 1 2 2 2 1 1 0 0 2 0 0 1 1 0 0 2 2 2 2 0 0 1]
[1 1 1 2 0 0 2 1 1 2 2 2 1 1 0 0 2 0 0 1 1 0 0 2 2 2 2 0 0 1]
0.9666666666666667
1
2
3
4
5
6
# 方法二
# 导入分类器报告包
from sklearn.metrics import classification_report
# 性能评估
report = classification_report(y_test, predicted)
print(report)
1
2
3
4
5
6
7
8
9
              precision    recall  f1-score   support

0 1.00 1.00 1.00 10
1 1.00 0.90 0.95 10
2 0.91 1.00 0.95 10

accuracy 0.97 30
macro avg 0.97 0.97 0.97 30
weighted avg 0.97 0.97 0.97 30

回归模型

常见的回归模型

模块名称 函数名称 算法名称
linear_model LinearRegression 线性回归
svm SVC 支持向量回归
neighbors KNeighborsRegressor 最近邻回归
tree DecisionTreeRegressor 回归决策树
ensemble RandomForestRegressor 随机森林回归
ensemble GradientBoostingRegressor 梯度提升回归树

构建回归模型

1
2
3
4
5
6
7
8
9
10
# 波士顿房价数据集
from sklearn.datasets import load_boston
from sklearn.linear_model import LinearRegression
from sklearn.model_selection import train_test_split
boston = load_boston()
print(boston.keys())
print(boston['data'].shape)
print(boston['target'].shape)
# print(boston['DESCR'])
print(boston['filename'])
1
2
3
4
dict_keys(['data', 'target', 'feature_names', 'DESCR', 'filename'])
(506, 13)
(506,)
/opt/conda/envs/python35-paddle120-env/lib/python3.7/site-packages/sklearn/datasets/data/boston_house_prices.csv
1
2
3
4
5
6
7
8
# 划分数据集
X_train, X_test, y_train, y_test = train_test_split(boston['data'], boston['target'], test_size=0.2)
# 模型训练
model = LinearRegression().fit(X_train, y_train)
# 系数项
print(model.coef_)
# 截距项
print(model.intercept_)
1
2
3
4
5
[-1.17770501e-01  4.97292914e-02  1.75137238e-02  2.96501210e+00
-1.85485342e+01 3.72322089e+00 2.26385762e-03 -1.47465810e+00
3.63311886e-01 -1.55027063e-02 -9.26416157e-01 7.48322310e-03
-5.12429648e-01]
38.21378514378925

评价回归模型

1
2
3
4
5
6
7
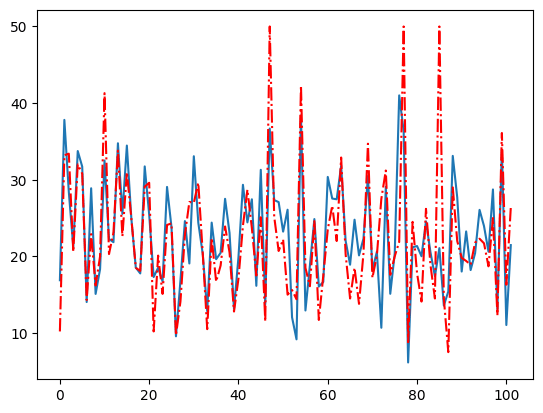
import matplotlib.pyplot as plt
predicted = model.predict(X_test)

plt.figure()
plt.plot(range(len(y_test)), predicted)
plt.plot(range(len(y_test)), y_test, 'r-.')
plt.show()

1
2
3
4
from sklearn.metrics import mean_squared_error 

# 计算均方误差
mean_squared_error(y_test, predicted)
1
22.261634716817298

逻辑回归模型

数据集介绍

鸢尾花数据(iris)数据集一共有150行数据,每行包含5个变量,其中4个特征变量,1个目标分类变量。

共有150个样本,目标变量为“花的类别”其都属于鸢尾属下的三个亚属,分别是变色鸢尾(Iris-versicolor)、山鸢尾(Iris-setosa)和维吉尼亚鸢尾(Iris-virginica)。

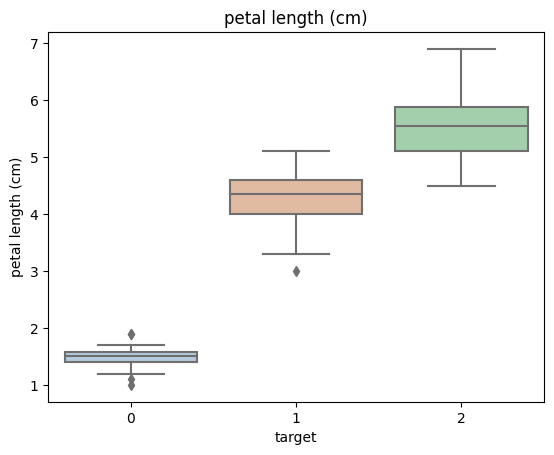
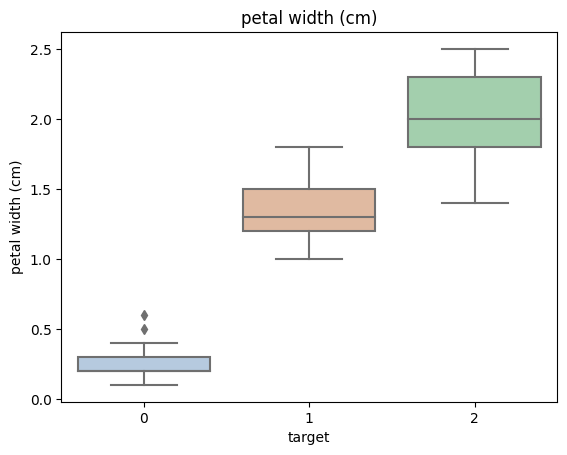
包含的三种鸢尾花的四个特征,分别是花萼长度(sepal length)、花萼宽度(sepal width)、花瓣长度(petal length)、花瓣宽度(petal width)。

任务目标

使用 Sklearn 实现鸢尾花分类,根据鸢尾花的花萼和花瓣大小将其分为三种不同的品种。

配置环境

1
2
3
4
5
6
7
8
9
10
11
# 基础函数库
import numpy as np
import pandas as pd

# 绘图函数库
import matplotlib.pyplot as plt
import seaborn as sns

# 导入逻辑回归模型函数
from sklearn.linear_model import LogisticRegression
from sklearn import metrics

加载数据

1
2
3
4
5
6
7
8
9
10
11
# 利用 sklearn 中自带的 iris 数据作为数据载入
from sklearn.datasets import load_iris

# 得到数据特征
data = load_iris()

# 得到数据对应的标签
iris_target = data.target

# 利用Pandas转化为DataFrame格式
iris_features = pd.DataFrame(data=data.data, columns=data.feature_names)

查看数据

1
2
# 查看数据的整体信息
iris_features.info()
1
2
3
4
5
6
7
8
9
10
11
<class 'pandas.core.frame.DataFrame'>
RangeIndex: 150 entries, 0 to 149
Data columns (total 4 columns):
# Column Non-Null Count Dtype
--- ------ -------------- -----
0 sepal length (cm) 150 non-null float64
1 sepal width (cm) 150 non-null float64
2 petal length (cm) 150 non-null float64
3 petal width (cm) 150 non-null float64
dtypes: float64(4)
memory usage: 4.8 KB
1
2
# 查看头部信息
iris_features.head()
1
2
3
4
5
6
   sepal length (cm)  sepal width (cm)  petal length (cm)  petal width (cm)
0 5.1 3.5 1.4 0.2
1 4.9 3.0 1.4 0.2
2 4.7 3.2 1.3 0.2
3 4.6 3.1 1.5 0.2
4 5.0 3.6 1.4 0.2
1
2
# 查看尾部信息
iris_features.tail()
1
2
3
4
5
6
     sepal length (cm)  sepal width (cm)  petal length (cm)  petal width (cm)
145 6.7 3.0 5.2 2.3
146 6.3 2.5 5.0 1.9
147 6.5 3.0 5.2 2.0
148 6.2 3.4 5.4 2.3
149 5.9 3.0 5.1 1.8
1
2
# 利用value_counts函数查看每个类别数量
pd.Series(iris_target).value_counts()
1
2
3
4
2    50
1 50
0 50
dtype: int64
1
2
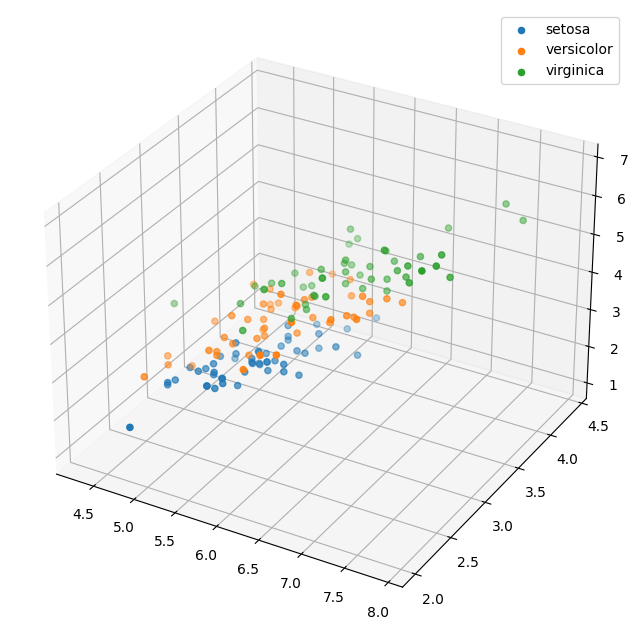
# 类别标签 0,1,2 分别代表'setosa', 'versicolor', 'virginica'三种不同花的类别。
iris_target
1
2
3
4
5
6
7
array([0, 0, 0, 0, 0, 0, 0, 0, 0, 0, 0, 0, 0, 0, 0, 0, 0, 0, 0, 0, 0, 0,
0, 0, 0, 0, 0, 0, 0, 0, 0, 0, 0, 0, 0, 0, 0, 0, 0, 0, 0, 0, 0, 0,
0, 0, 0, 0, 0, 0, 1, 1, 1, 1, 1, 1, 1, 1, 1, 1, 1, 1, 1, 1, 1, 1,
1, 1, 1, 1, 1, 1, 1, 1, 1, 1, 1, 1, 1, 1, 1, 1, 1, 1, 1, 1, 1, 1,
1, 1, 1, 1, 1, 1, 1, 1, 1, 1, 1, 1, 2, 2, 2, 2, 2, 2, 2, 2, 2, 2,
2, 2, 2, 2, 2, 2, 2, 2, 2, 2, 2, 2, 2, 2, 2, 2, 2, 2, 2, 2, 2, 2,
2, 2, 2, 2, 2, 2, 2, 2, 2, 2, 2, 2, 2, 2, 2, 2, 2, 2])
1
2
# 对于特征进行一些统计描述
iris_features.describe()
1
2
3
4
5
6
7
8
9
10
11
12
13
14
15
16
17
18
19
       sepal length (cm)  sepal width (cm)  petal length (cm)  \
count 150.000000 150.000000 150.000000
mean 5.843333 3.057333 3.758000
std 0.828066 0.435866 1.765298
min 4.300000 2.000000 1.000000
25% 5.100000 2.800000 1.600000
50% 5.800000 3.000000 4.350000
75% 6.400000 3.300000 5.100000
max 7.900000 4.400000 6.900000

petal width (cm)
count 150.000000
mean 1.199333
std 0.762238
min 0.100000
25% 0.300000
50% 1.300000
75% 1.800000
max 2.500000

数据可视化

1
2
3
4
# 进行浅拷贝,防止对于原始数据的修改
iris_all = iris_features.copy()
# 合并标签和特征信息
iris_all['target'] = iris_target
1
2
3
4
5
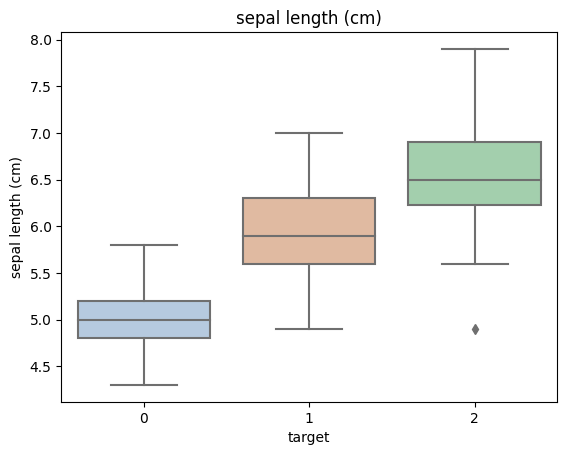
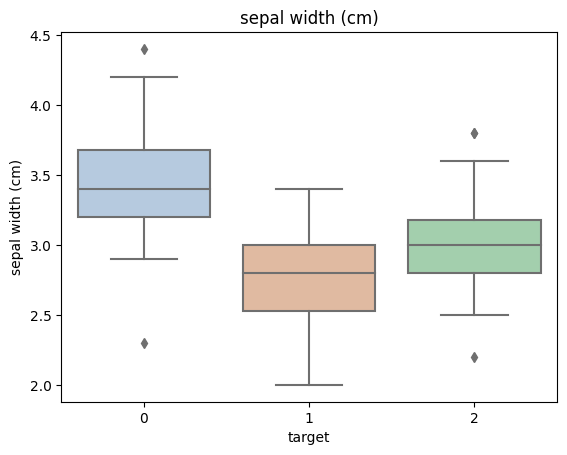
# 利用箱型图我们也可以得到不同类别在不同特征上的分布差异情况
for col in iris_features.columns:
sns.boxplot(x='target', y=col, saturation=0.5,palette='pastel', data=iris_all)
plt.title(col)
plt.show()

1
2
3
4
5
6
7
8
9
10
11
12
13
14
15
16
# 选取其前三个特征绘制三维散点图
from mpl_toolkits.mplot3d import Axes3D

fig = plt.figure(figsize=(10,8))
ax = fig.add_subplot(111, projection='3d')

iris_all_class0 = iris_all[iris_all['target']==0].values
iris_all_class1 = iris_all[iris_all['target']==1].values
iris_all_class2 = iris_all[iris_all['target']==2].values

# 'setosa'(0), 'versicolor'(1), 'virginica'(2)
ax.scatter(iris_all_class0[:,0], iris_all_class0[:,1], iris_all_class0[:,2],label='setosa')
ax.scatter(iris_all_class1[:,0], iris_all_class1[:,1], iris_all_class1[:,2],label='versicolor')
ax.scatter(iris_all_class2[:,0], iris_all_class2[:,1], iris_all_class2[:,2],label='virginica')
plt.legend()
plt.show()

构建二分类逻辑回归模型

1
2
3
4
5
6
7
8
9
# 将数据划分为训练集和测试集
from sklearn.model_selection import train_test_split

# 选择其类别为0和1的样本 (因为是二分类,所以不包括类别为2的样本)
iris_features_part = iris_features.iloc[:100]
iris_target_part = iris_target[:100]

# 训练集大小为80%,测试集大小为20%
x_train, x_test, y_train, y_test = train_test_split(iris_features_part, iris_target_part, test_size = 0.2, random_state = 2020)
定义逻辑回归模型
1
2
3
4
5
# 定义逻辑回归模型 
clf = LogisticRegression(random_state=0, solver='lbfgs')

# 在训练集上训练逻辑回归模型
clf.fit(x_train, y_train)
1
2
3
4
5
LogisticRegression(C=1.0, class_weight=None, dual=False, fit_intercept=True,
intercept_scaling=1, l1_ratio=None, max_iter=100,
multi_class='auto', n_jobs=None, penalty='l2',
random_state=0, solver='lbfgs', tol=0.0001, verbose=0,
warm_start=False)
1
2
3
4
5
6
7
# 查看其对应的w
print('the weight of Logistic Regression:',clf.coef_)

# 查看其对应的w0
print('the intercept(w0) of Logistic Regression:',clf.intercept_)
the weight of Logistic Regression: [[ 0.45181973 -0.81743611 2.14470304 0.89838607]]
the intercept(w0) of Logistic Regression: [-6.53367714]
模型预测
1
2
3
4
5
6
7
8
9
10
11
12
13
14
15
16
17
18
# 利用训练好的模型进行预测
train_predict = clf.predict(x_train)
test_predict = clf.predict(x_test)

# 利用accuracy评估模型效果
print('The accuracy of the Logistic Regression is:',metrics.accuracy_score(y_train,train_predict))
print('The accuracy of the Logistic Regression is:',metrics.accuracy_score(y_test,test_predict))

# 查看混淆矩阵(预测值和真实值的各类情况统计矩阵)
confusion_matrix_result = metrics.confusion_matrix(test_predict,y_test)
print('The confusion matrix result:\n',confusion_matrix_result)

# 利用热力图对于结果进行可视化
plt.figure(figsize=(8, 6))
sns.heatmap(confusion_matrix_result, annot=True, cmap='Blues')
plt.xlabel('Predicted labels')
plt.ylabel('True labels')
plt.show()
1
2
3
4
5
The accuracy of the Logistic Regression is: 1.0
The confusion matrix result:
[[ 9 0]
[ 0 11]]

小结:二分类逻辑回归模型的准确度为1,代表所有的样本都预测正确了

构建三分类逻辑回归模型

1
2
3
4
5
6
7
8
# 训练集大小为80%,测试集大小为20%
x_train, x_test, y_train, y_test = train_test_split(iris_features, iris_target, test_size = 0.2, random_state = 2020)

# 定义逻辑回归模型
clf = LogisticRegression(random_state=0, solver='lbfgs')

# 在训练集上训练逻辑回归模型
clf.fit(x_train, y_train)
1
2
3
4
5
LogisticRegression(C=1.0, class_weight=None, dual=False, fit_intercept=True,
intercept_scaling=1, l1_ratio=None, max_iter=100,
multi_class='auto', n_jobs=None, penalty='l2',
random_state=0, solver='lbfgs', tol=0.0001, verbose=0,
warm_start=False)
由三个参数逻辑回归组合起来即可实现三分类逻辑回归模型
1
2
3
4
5
# 查看其对应的w
print('the weight of Logistic Regression:\n',clf.coef_)

# 查看其对应的w0
print('the intercept(w0) of Logistic Regression:\n',clf.intercept_)
1
2
3
4
5
6
the weight of Logistic Regression:
[[-0.45928925 0.83069893 -2.26606528 -0.99743983]
[ 0.33117319 -0.72863427 -0.06841147 -0.98711029]
[ 0.12811605 -0.10206466 2.33447675 1.98455011]]
the intercept(w0) of Logistic Regression:
[ 9.43880648 3.93047366 -13.36928014]
模型预测
1
2
3
4
5
6
7
8
9
10
# 在训练集和测试集上分布利用训练好的模型进行预测
train_predict = clf.predict(x_train)
test_predict = clf.predict(x_test)

# 由于逻辑回归模型是概率预测模型,所以我们可以利用 predict_proba 函数预测其概率
train_predict_proba = clf.predict_proba(x_train)
test_predict_proba = clf.predict_proba(x_test)

# 其中第一列代表预测为0类的概率,第二列代表预测为1类的概率,第三列代表预测为2类的概率
print('The test predict Probability of each class:\n',test_predict_proba)
1
2
3
4
5
6
7
8
9
10
11
12
13
14
15
16
17
18
19
20
21
22
23
24
25
26
27
28
29
30
31
The test predict Probability of each class:
[[1.03461744e-05 2.33279482e-02 9.76661706e-01]
[9.69926591e-01 3.00732871e-02 1.21677013e-07]
[2.09992556e-02 8.69156613e-01 1.09844131e-01]
[3.61934879e-03 7.91979964e-01 2.04400687e-01]
[7.90943230e-03 8.00605296e-01 1.91485272e-01]
[7.30034943e-04 6.60508053e-01 3.38761912e-01]
[1.68614215e-04 1.86322047e-01 8.13509339e-01]
[1.06915328e-01 8.90815535e-01 2.26913684e-03]
[9.46928073e-01 5.30707270e-02 1.20016068e-06]
[9.62346387e-01 3.76532213e-02 3.91897322e-07]
[1.19533394e-04 1.38823471e-01 8.61056996e-01]
[8.78881872e-03 6.97207354e-01 2.94003828e-01]
[9.73938144e-01 2.60617330e-02 1.22613847e-07]
[1.78434059e-03 4.79518175e-01 5.18697484e-01]
[5.56924354e-04 2.46776840e-01 7.52666235e-01]
[9.83549843e-01 1.64500656e-02 9.13617317e-08]
[1.65201472e-02 9.54672748e-01 2.88071050e-02]
[8.99853767e-03 7.82707573e-01 2.08293890e-01]
[2.98015043e-05 5.45900079e-02 9.45380191e-01]
[9.35695860e-01 6.43039550e-02 1.85301397e-07]
[9.80621191e-01 1.93787393e-02 7.00125326e-08]
[1.68478824e-04 3.30167230e-01 6.69664291e-01]
[3.54046185e-03 4.02267802e-01 5.94191737e-01]
[9.70617286e-01 2.93824720e-02 2.42443985e-07]
[2.56895220e-04 1.54631585e-01 8.45111520e-01]
[3.48668506e-02 9.11966137e-01 5.31670125e-02]
[1.47218859e-02 6.84038109e-01 3.01240005e-01]
[9.46510500e-04 4.28641988e-01 5.70411501e-01]
[9.64848138e-01 3.51516742e-02 1.87917905e-07]
[9.70436781e-01 2.95624007e-02 8.18591669e-07]]
1
2
3
# 利用accuracy(准确度)【预测正确的样本数目占总预测样本数目的比例】评估模型效果
print('The accuracy of the Logistic Regression is:',metrics.accuracy_score(y_train,train_predict))
print('The accuracy of the Logistic Regression is:',metrics.accuracy_score(y_test,test_predict))
1
2
The accuracy of the Logistic Regression is: 0.9833333333333333
The accuracy of the Logistic Regression is: 0.8666666666666667
1
2
3
4
5
6
7
8
9
10
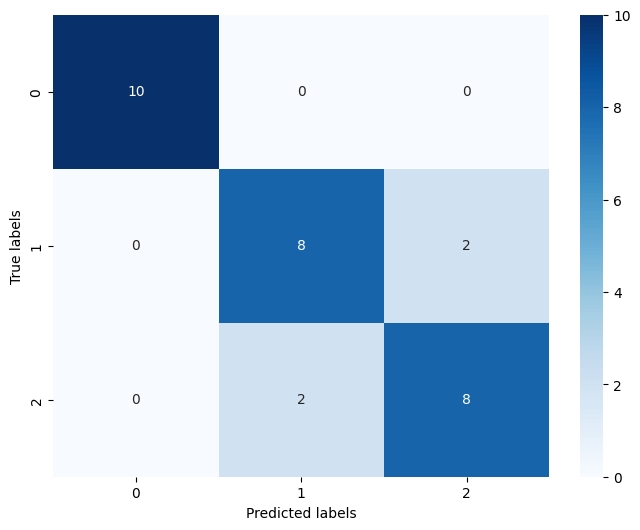
# 查看混淆矩阵
confusion_matrix_result = metrics.confusion_matrix(test_predict,y_test)
print('The confusion matrix result:\n',confusion_matrix_result)

# 利用热力图对于结果进行可视化
plt.figure(figsize=(8, 6))
sns.heatmap(confusion_matrix_result, annot=True, cmap='Blues')
plt.xlabel('Predicted labels')
plt.ylabel('True labels')
plt.show()
1
2
3
4
The confusion matrix result:
[[10 0 0]
[ 0 8 2]
[ 0 2 8]]

小结:三分类逻辑回归模型在测试集上的准确度为: 86.67%

从sklearn开始机器学习 2聚类分类回归和逻辑回归
https://steammilk.com/2022/11/03/2022-all/ML-2/
作者
蒸奶泡
发布于
2022年11月3日
更新于
2025年1月8日
许可协议